Calendar and visual language
How to read the monthly grid, what each colour and icon means, and how predictions work.
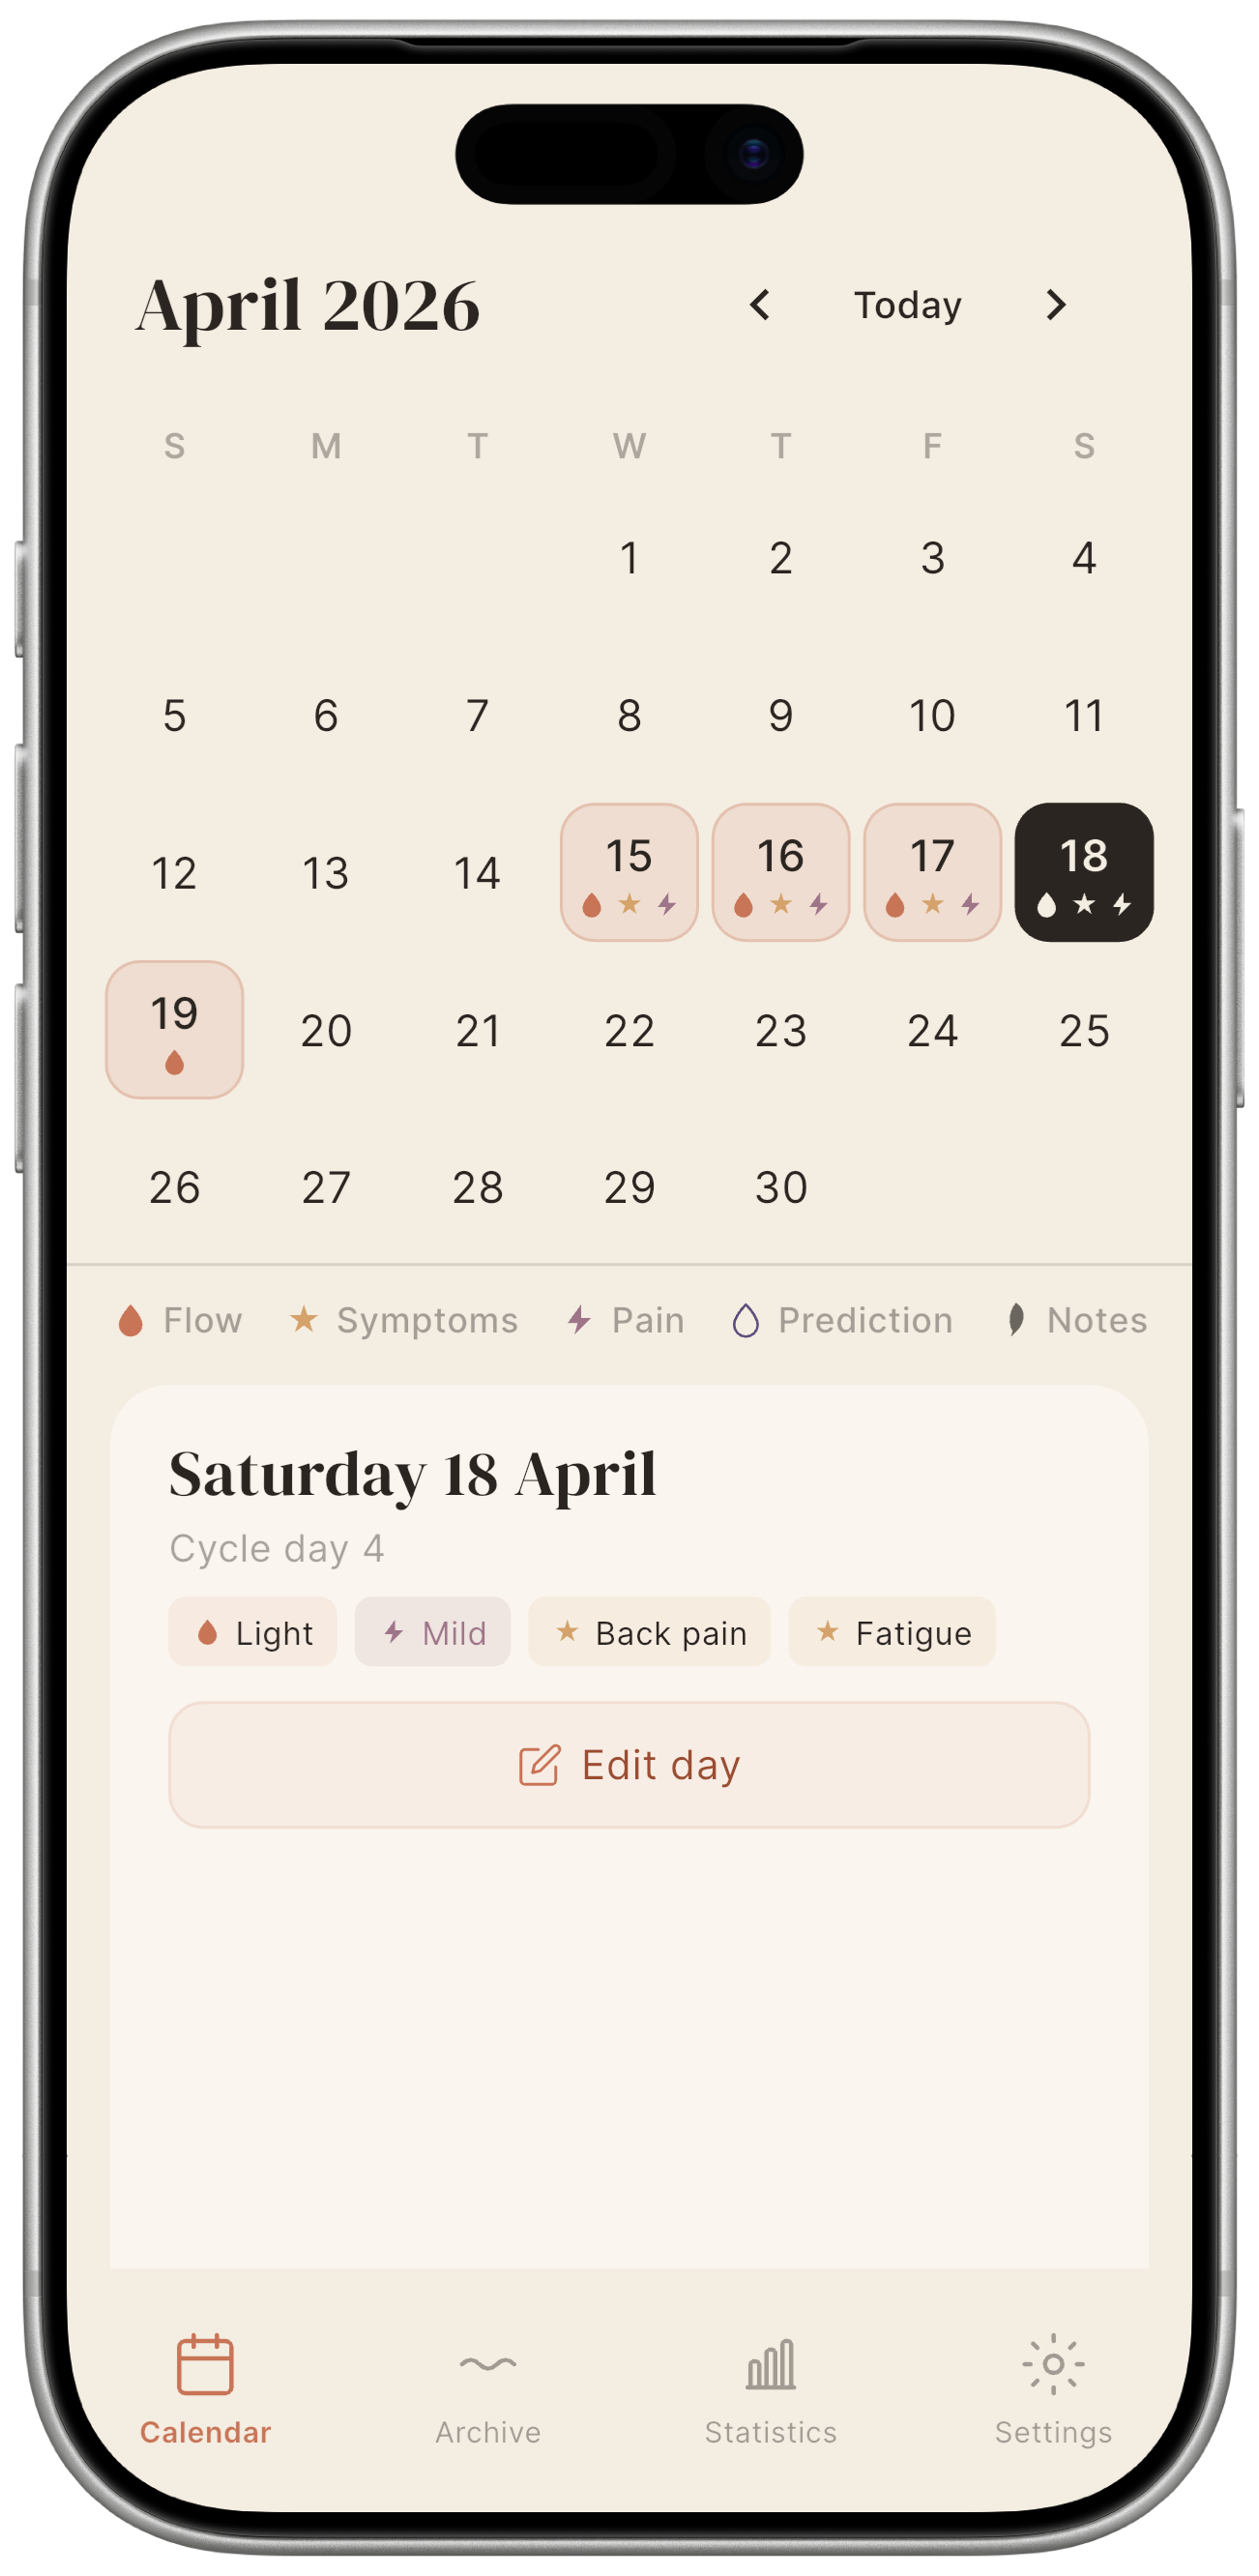
The Calendar tab is the main screen of Mētra. This is where the app’s visual language takes shape: colours, icons, a prediction window: a small vocabulary, but one worth learning.
The monthly grid
Each day is a small cell. Past days may have coloured cells and icons under the day number; future days may carry prediction markers.
Tap any day to open its day detail panel, which shows everything recorded for that date.
The ← → arrows in the header move between months; the Today button returns to the current month from anywhere. You can also swipe horizontally on the grid: right for the previous month, left for the next: but forward swipes stop at the month after the current one.
Visual language: colours
Mētra uses a fixed colour vocabulary: four colours, four meanings. Once you know them, an entire month reads at a glance.
| Colour | Name | Meaning |
|---|---|---|
| Terracotta (warm red-orange) | Flow | A day with menstrual flow or spotting logged. |
| Lavender (muted purple) | Prediction | A day the app predicts will fall inside your next period window. |
| Ochre (warm gold) | Symptoms | The day has at least one symptom logged (e.g. headache, bloating). |
| Mauve (dusty rose) | Pain | The day has a pain intensity recorded. |
Visual language: icons
Five icons complete the vocabulary. They appear under the day number in the grid and inside the day detail panel.
| Icon | Meaning |
|---|---|
| Filled drop | Menstruation logged for this day. |
| Outline drop | Predicted menstruation (no entry yet). |
| Star | At least one symptom recorded. |
| Lightning bolt | Pain intensity recorded. |
| Pen | A free-text note is present for this day. |
The legend strip

The legend strip sits just below the calendar grid. It shows the five icons described above with their labels: the full vocabulary, always in view.
Predictions
The math is in the open, not inside a black box. Mētra calculates a predicted start date using a weighted moving average of your last six logged cycles, with more recent cycles carrying more weight. No AI, no opaque model: the formula is documented in the source code.
- The prediction window appears as lavender outline cells in the calendar.
- The prediction updates automatically every time you save a daily entry that starts a new cycle.
No logged cycles yet? The prediction is based on the values you entered during first setup. It becomes more accurate after two or three cycles.
The day detail panel
Tap a day to open a panel that brings together everything for that date:
- A “Cycle day N” label shows where you are in your current cycle.
- Flow pill: the logged flow type and intensity, or the predicted status.
- Pain pill: pain level (Mild / Moderate / Severe), if recorded.
- Symptom chips: one chip per symptom recorded that day.
- Notes: free-text note, if any.
- Add day or Edit day button: opens the daily entry screen for that day.